Vol. 12, No.6 / The Growing U.S. Oyster Aquaculture Industry
Abstract
- In this issue, Dr. Posadas shows the overall trends in farm production of oysters, farmgate values, and imputed farmgate prices over time.
- Oyster farm production, farmgate values, and farmgate prices in specific states are compiled as they become publicly available.
- The investment requirements and potential productive capacity of specific oyster aquaculture production systems are collected from existing literature.
- Results of economic simulations on the financial feasibility of specific oyster aquaculture production systems are presented.
Suggested Citation:
Posadas, B.C. The Growing U.S Oyster Aquaculture Industry. Mississippi MarketMaker Newsletter, Vol. 12, No. 6. June 21, 2022. http://extension.msstate.edu/newsletters/mississippi-marketmaker.
Acknowledgment
This newsletter is a contribution of the Mississippi Agricultural and Forestry Experiment Station and the Mississippi State University Extension Service. This material is based upon work that is supported in part by the National Institute of Food and Agriculture, U.S. Department of Agriculture, Hatch project under accession number 081730 and NOAA (Office of Sea Grant, U.S. Dept. of Commerce, under Grant NA10OAR4170078, Mississippi Alabama Sea Grant Consortium).
Introduction
- The NOAA Fisheries data on national oyster aquaculture production are reported in pounds of meat per year.
- Since there are no oyster aquaculture data that are available after 2018, the 2019-21 data are predicted values estimated by Dr. Posadas.
- The NOAA Fisheries data on national oyster aquaculture farmgate values are reported in dollars per year.
- The national farmgate prices of farmed oysters are imputed from the farmgate values and pounds of meat.
- The MS data on oyster aquaculture production are reported in number of single oysters.
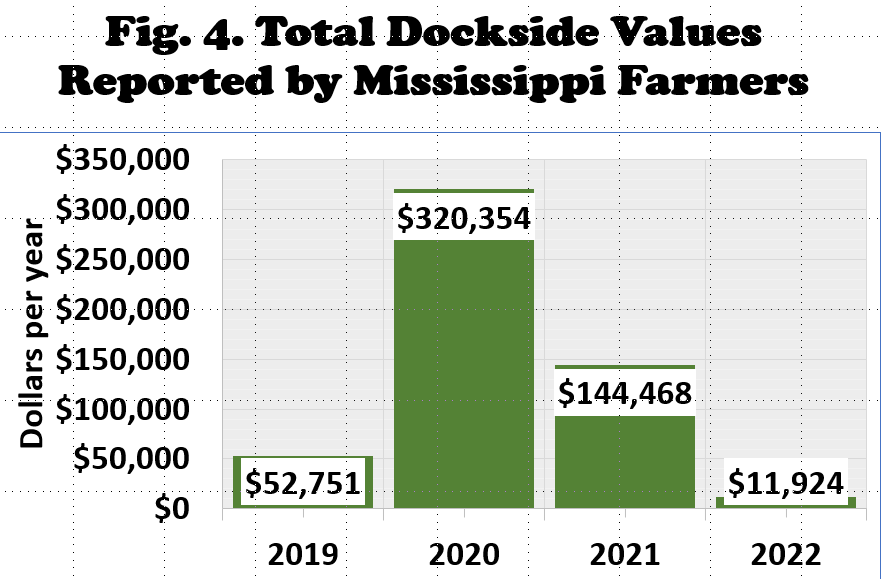
- The MS oyster farmgate values are reported in dollars.
- The MS farmgate price is reported in dollars per single oyster.
- The MD data on oyster aquaculture production are reported in number of individual oysters and in bushels.
- The MD oyster dockside values are reported in dollars.
Economic Analysis
Economic simulations are performed in Excel showing the financial feasibility of specific oyster aquaculture production systems:
- Initial investment - the total cash outflow that occurs at the inception of the project.
- Enterprise budget - listing of all income and expenses associated with a specific enterprise
- Payback period - time required to recoup the cost of an initial investment via the cash flows generated by the investment.
- Net present value (NPV) - the present value of the cash flows at your project's required rate of return compared to your initial investment.
- Internal rate of return (IRR) - a financial analysis metric to estimate potential investments' profitability. In a discounted cash flow analysis, IRR is a discount rate that makes the net present value (NPV) of all cash flows equal to zero.
Summary Of Commercial Oyster Landings
- Posadas (2022 a, b) summarized the status of commercial oyster landings in the U.S., the Gulf of Mexico region, and the state of Mississippi.
- Over time, the overall trend of U.S. commercial oyster landings has been downwards since 1930.
- The Gulf produced most oysters in 2000, but its share declined after the Deepwater Horizon oil spill in 2010.
- In the Gulf, the initial trend between 1950 and 1990 was upward. Afterward, the trend was downhill toward its lowest level recently.
- In Mississippi, oyster landings were very erratic. Recent coastal hazards wiped out its public oyster reefs. No oyster landings were reported after 2018.
- Habitat degradation, pollution, overfishing, oyster diseases, predation, coastal hazards, rapid coastal development, and more led to these overall downward trends in oyster landings.
Summary Of Oyster Landings By Species
- Posadas (2022 a, b) summarized major species' commercial oyster landings in the U.S.
- The two most important species harvested in the U.S. are the Eastern oyster and the Pacific oyster.
- Three other oyster species are harvested in limited quantities – European flat, Pacific, and Kumamoto oysters.
- The Eastern oyster dominates the domestic market, but its share has declined over the years.
- The Pacific oyster has steadily gained more market share, especially for two decades.
Summary Of Oyster Dockside Values And Prices
- Posadas (2022 a, b) summarized dockside values and prices of commercial oyster landings in the U.S.
- The dockside prices of both species are rising over time.
- In 2020, Eastern oysters landed at $10 per pound of meat, while the Pacific oysters landed at $8 per pound.
- These rising dockside prices of oysters landed in the U.S. boosted the dockside values of oysters during the past decade.
Summary Of U.S. Oyster Aquaculture Production And Farmgate Values
- Posadas (2022 a, b) summarized the status of oyster aquaculture in the U.S.
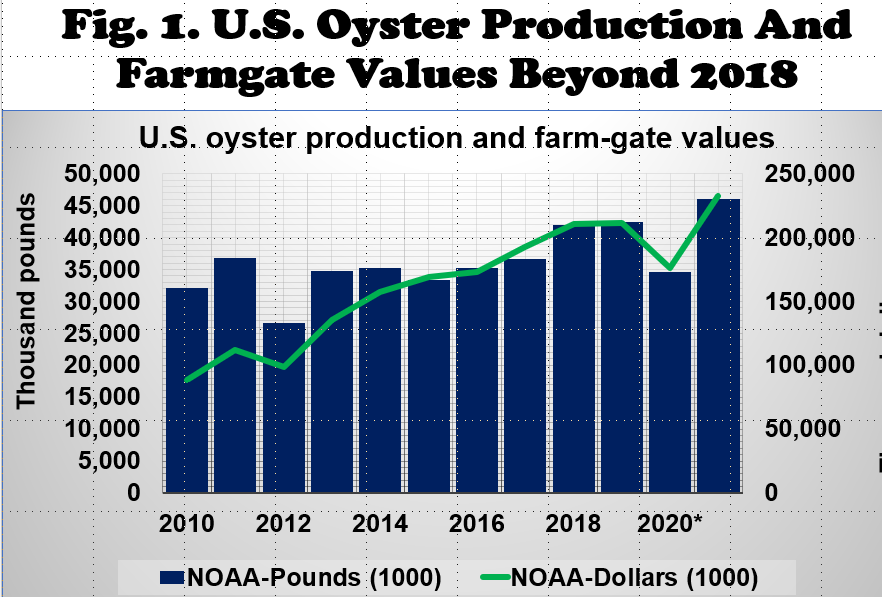
- Oyster aquaculture annual production averaged 23 million pounds, valued at $60 million per year from 1984 to 1996.
- Between 1997 and 2008, annual oyster aquaculture production fell to 19 million pounds, with farmgate value averaging $62 million.
- Past decade, oyster aquaculture production expanded, averaging 35 million pounds per year, valued at $143 million.
- Annual growth in oyster aquaculture fluctuated vigorously starting in 2005 until 2013. The annual growth rate rose recently, reaching over 14% in 2018.
- The average farmgate prices started to rise in the 1980s and hovered around $3 per pound until the 1990s until the early 2000s.
- After that, average farmgate prices fell, then climbed until 2018 reaching an average of $5 per pound of oyster meat.
- In the past decade, oyster production added to total aquaculture production averaging 5% of output and 10% of value.
- Recent recession and Covid-19 global pandemic impacted oyster production since 2019 (Fig. 1).
- Oyster production in 2019-21 (Fig. 1) are predicted values based on an economic model developed by Dr. Posadas.
Summary Of Mississippi Oyster Aquaculture Program
- The Mississippi Department of Marine Resources Off-Bottom Oyster Aquaculture program has been increasingly successful since its start in 2018.
- The program includes classroom and field education in oyster aquaculture production and techniques, as well as aiding in development of operational and business plans for their future in the industry.
- The Deer Island Aquaculture Park now provides upwards of 450 acres of potential aquaculture real estate, increasing from the 50 initial acres in 2018.
- With the completion of 2018 and 2019 classes, MDMR currently has 51 acres leased by 24 farmers and upwards of 2.8 million oyster seed being cultured.
-
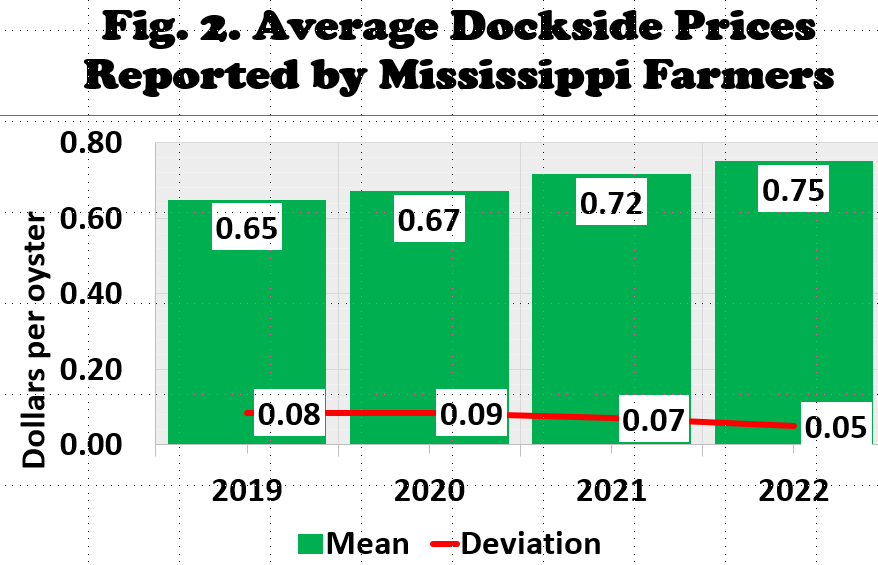
Figure 2 - MDMR’s 2020 class has more participants than ever before, so the expected number of leased acreage is expected to double industry production and sale volume.
- The source of raw data on MS oyster farming is the Mississippi Department of Marine Resources. The data in 2022 included the first nine weeks only.
- The 2019 MS season was severely impacted by the twice prolonged openings of the Bonnet Carre Spillway, reducing salinity to deadly levels in the grow-out areas.
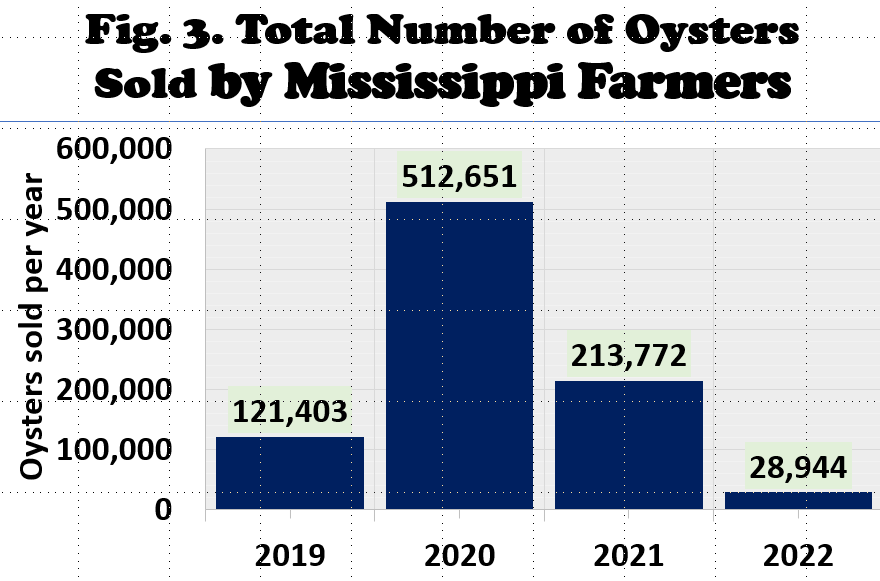
- MS oyster farmers sold over 121,000 oysters at an average farmgate price of $0.65 per oyster (Fig. 2-3).
- In 2020, the MS off-bottom oyster industry sold over 512,000 individual oysters at an average farmgate price of $0.67 per single oyster (Fig. 2-3).
- Most of these oysters were saved during the twice prolonged freshwater intrusion in 2019 by moving them to safe waters in Alabama.
- However, the very low salinity levels in the growing areas in 2019 killed significant amounts of oysters.
- The 2021 MS season was adversely affected by the Covid-19 global pandemic when restaurant sales plummeted.
- MS oyster farmers sold over 213,000 single oysters at an average price of $0.72 per single oyster (Fig. 2-3).
- The 2022 season had a good start - farmgate prices average $0.75 per single oyster during the first three months (Fig. 2).
Summary Of Maryland Oyster Aquaculture Production
- Source of raw data: Dr. Matt Parker, University of Maryland Extension.
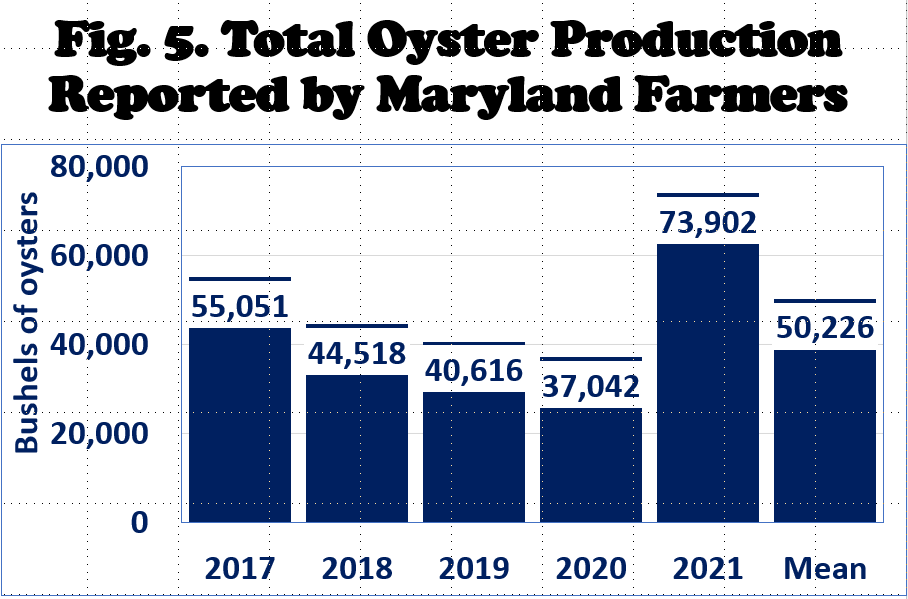
- Maryland annual farmed oyster production averaged 4.3 million individual oysters or 50,000 bushes of oysters (Fig. 5).
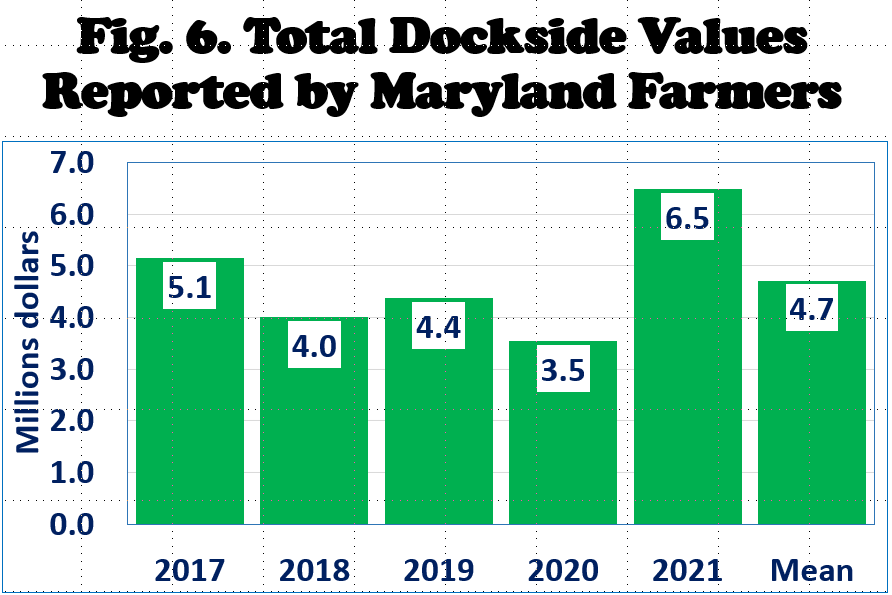
- The dockside values of farmed oysters reached $4.7 million per year from 2017 to 2021 (Fig. 6).
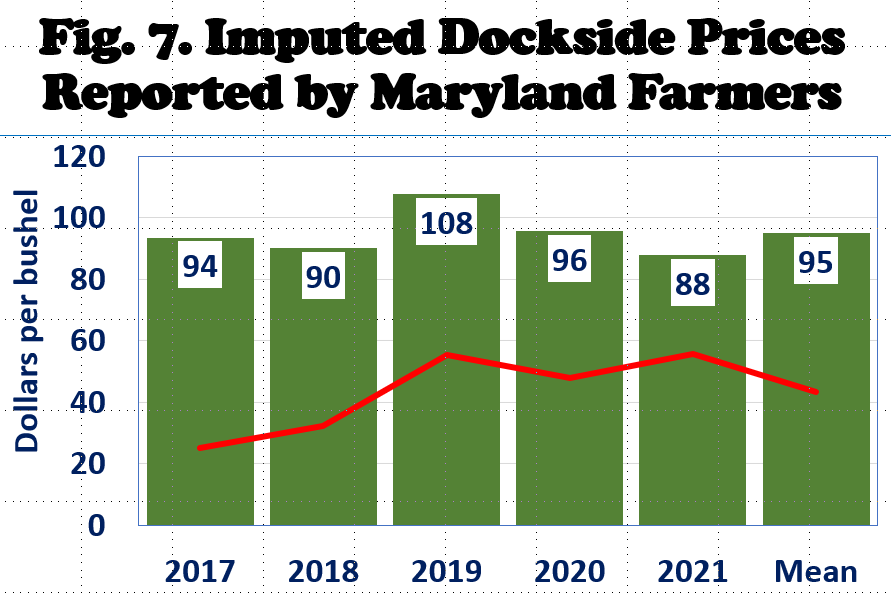
- The imputed dockside prices of farmed oysters averaged $95 (± $43) per bushel (Fig. 7).
Summary Of Economic Simulations On Oyster Aquaculture Productions Systems
- This investment analysis used the Auburn Extension Oyster Aquaculture Floating Cage Farm Budget.
- This Northern Gulf of Mexico 200-cage oyster farm is assumed to produce an annual production of 200,000 oysters.
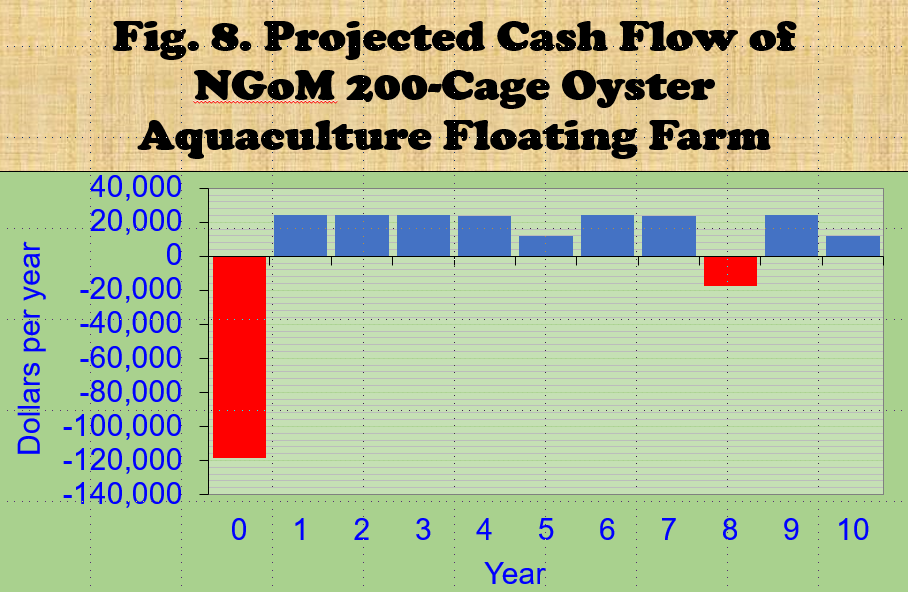
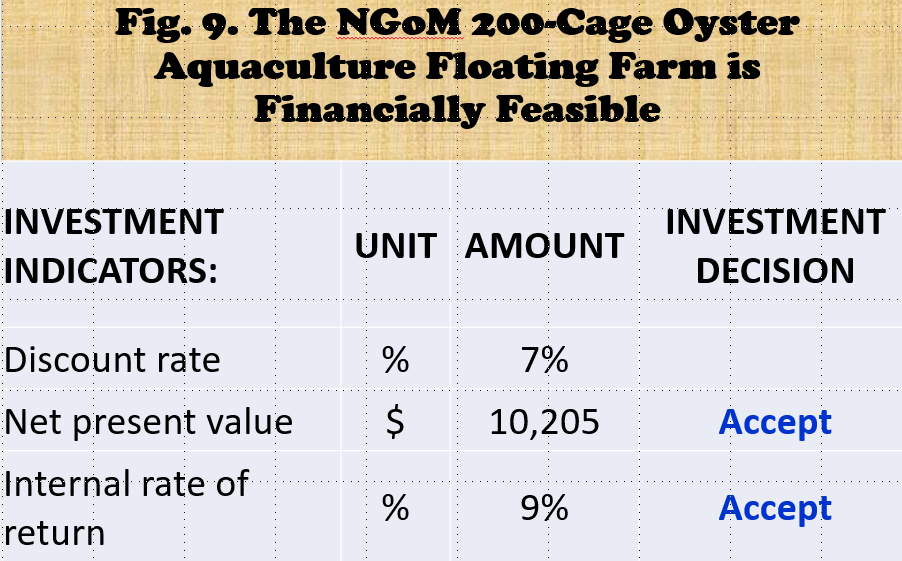
- The proposed oyster farm is considered a financially acceptable investment at a farmgate price of $0.50 per oyster (Fig. 8-9).
- Improved financial feasibility are expected at higher farmgate prices.
- Higher oyster mortality rates will reduce the economic viability of this production system.
Northern Gulf Of Mexico (Ngom) 200-Cage Oyster Aquaculture Floating Farm
- Initial investment requirements - $118,600 per farm.
- Lease size – 2 acres per farm.
- Growing cages – 200 cages per farm.
- Culture period – 1 year per crop.
- Desired annual oyster production – 200,000 oysters.
- Initial farmgate price assumed - $0.50 per oyster.
- The observed farmgate price exceeded $0.65 per oyster.
My Economic Outreach On Oysters
- Posadas, B.C. 2022e. The Growing U.S. Oyster Aquaculture Industry. Mississippi MarketMaker Newsletter, Vol. 12, No. 6. June 21.
- Posadas, B.C. 2022d. 2022 Growing U.S. Oyster Aquaculture Industry. MSU-CREC Virtual Presentation. June 16.
- Posadas, B.C. 2022c. 2022 Growing Oyster Aquaculture Industry. MSU-CREC Virtual Presentation. May 31.
- Posadas, B.C. 2022b. Long-term Shifts in Oyster Supply and Prices in U.S. Domestic Markets. Mississippi MarketMaker Newsletter, Vol. 12, No. 5. May 24.
- Posadas, B.C. 2022a. Long-term Shifts in Oyster Supply and Prices in U.S. Domestic Markets. MSU-CREC Virtual Presentation. May 23.
- Posadas, B.C. 2020. Economic Impacts of Coastal Hazards on Mississippi Commercial Oyster Fishery from 2005 to 2016. J. Ocean and Coastal Econ. 6(1).
- Posadas, B.C., and B.K.A. Posadas, Jr. 2017a. Economic Impacts of the Opening of the Bonnet Carre Spillway to the Mississippi Oyster Fishery. J. Food Distr. Soc., 48(1). 42-45.


